
Providing supply chain analytics to global brands
My role
Product Designer, Marketer
Team
Company-wide initiative
Platforms
Mobile (iOS, Android)
Web
Timeline
2022–2023
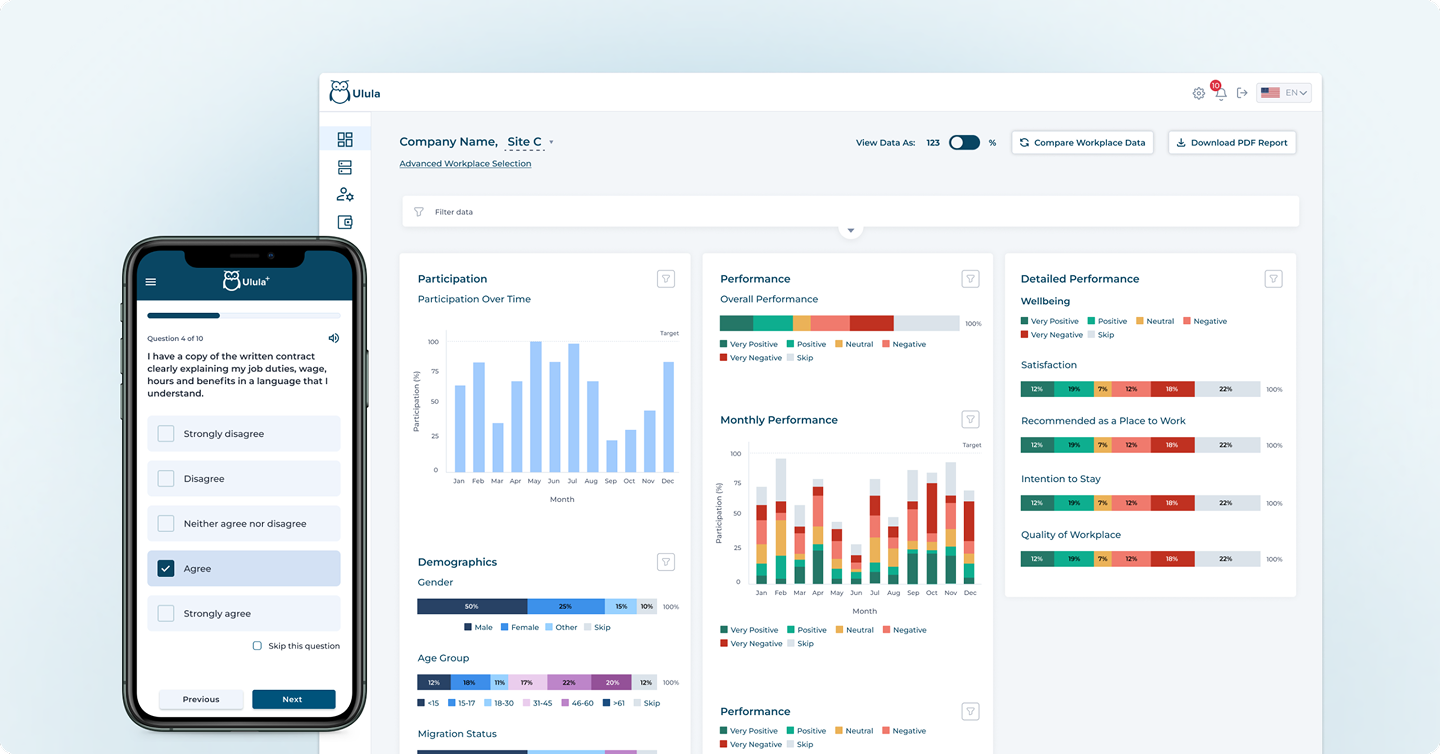
Supply chain complexity hides labor risks
Global supply chains are fragmented, offshore, and often subcontracted, leaving brands with limited visibility into labor and human rights conditions. As new legislation mandates public disclosure of supply chain risks, companies must prove they can identify and remediate issues, yet most lack reliable, ground-level data.
Surfacing insights about working conditions on the ground
We designed a technology-enabled system that gathers trustworthy worker feedback across languages, devices, and literacy levels, and transforms it into credible, report-ready insights. The system has two core components:
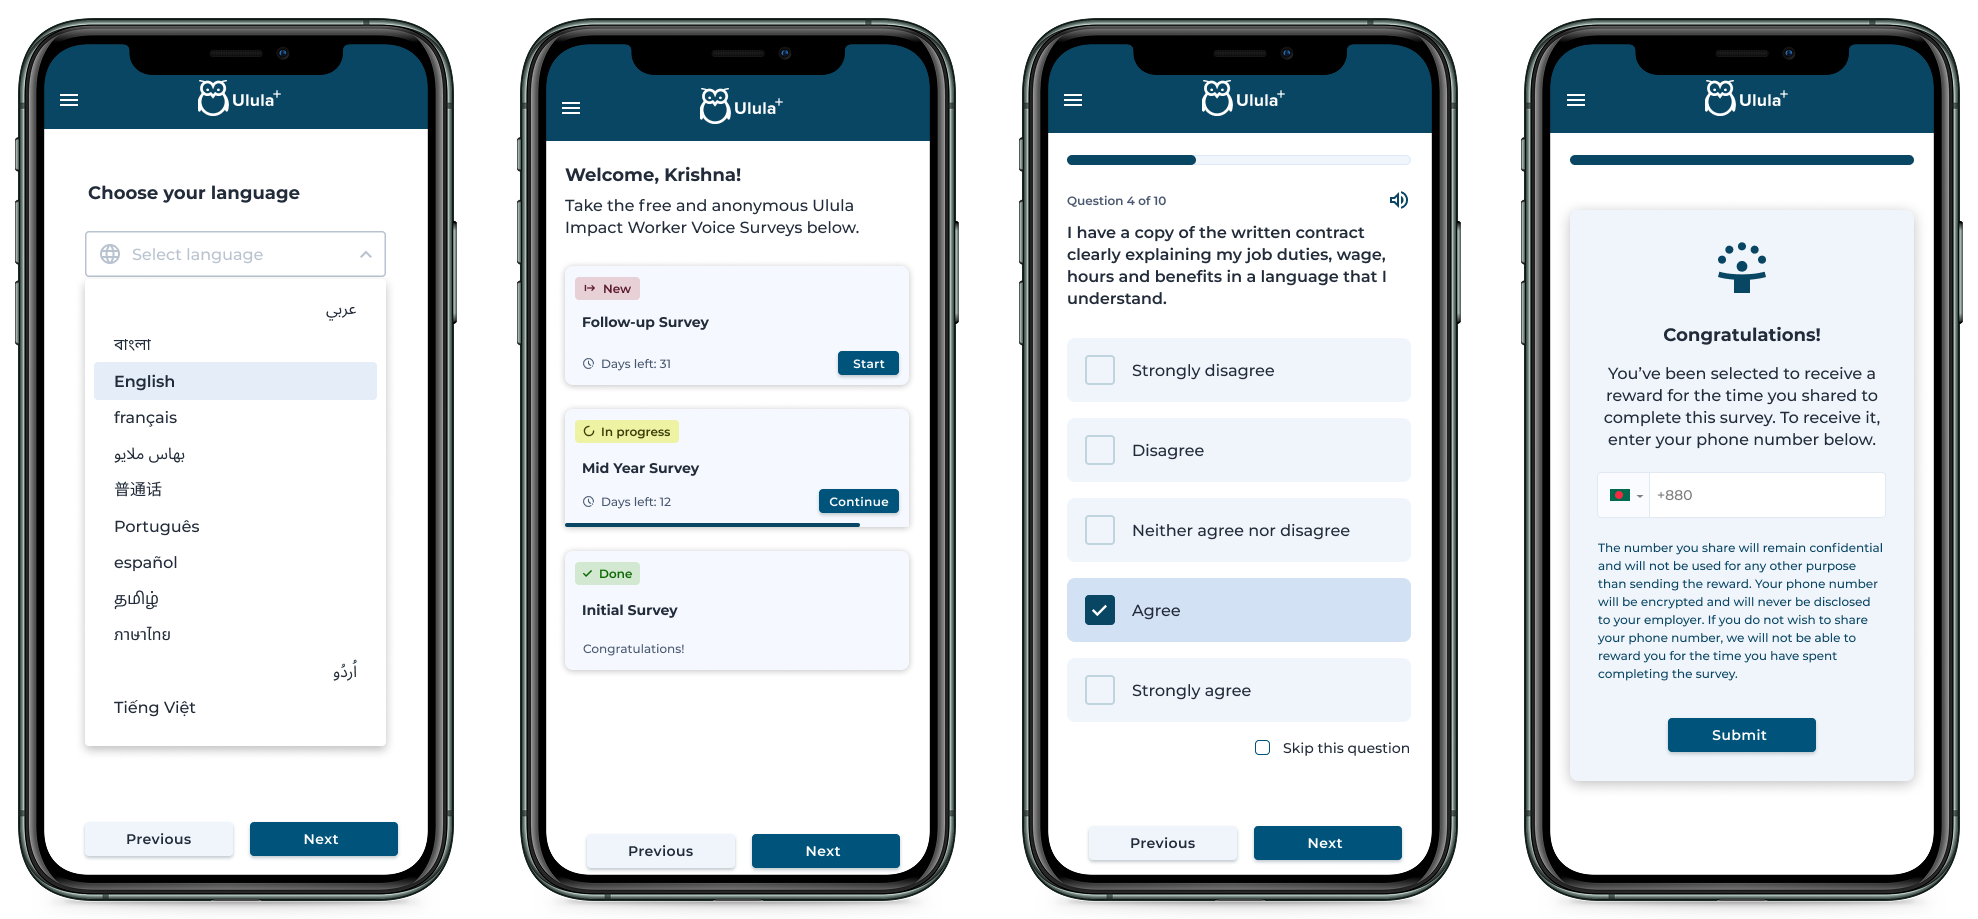
Worker-centered data collection
We designed a mobile survey experience that enables workers to safely report on working conditions, wages, hours, safety, and management practices using their own devices.
Target user: ground-level workersReal-time risk visualization
We designed a live dashboard that translates raw survey responses into clear, actionable insights for global brands. The dashboard highlights:
- emerging labor and human rights risks
- severity and frequency of reported issues
- geographic and supplier-level patterns
- areas requiring corrective action
By structuring and visualizing worker-reported data, the platform enables brands to prioritize interventions, meet regulatory reporting requirements, and move from reactive audits to continuous visibility.
Target user: global brandsIdentifying the primary users
I facilitated a persona mapping exercise with sales and programs departments to identify core user segments of the new product, understand needs and pain points and how those should inform design.
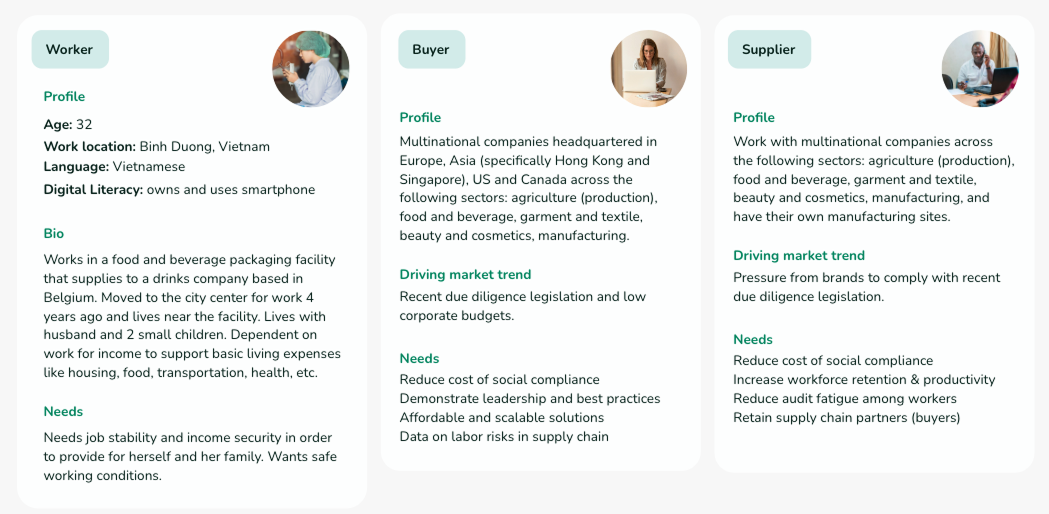
Workers need…
to feel safe and protected from retaliation in order to share honest feedback about working conditions, labor and human rights risks. Digital tools would need to be accessible, inclusive, adapted to local contexts to gain trust and usage from workers.
Buyers need…
accurate and easy to understand data on labor and human rights risks in their supply chain in order to comply with legally binding social compliance requirements.
Suppliers need…
to maintain business relationships with their buyers to ensure operational stability and longevity, as well as reduce the cost of social compliance from repeat audits conducted by different buyers sourcing from the same facilities.
Identifying product differentiators through competitive analysis
I organized a competitor analysis framework and facilitated workshops with our sales and customer success teams to share research insights, exchange knowledge internally and collectively identify the unique selling proposition (USP) of our new product.
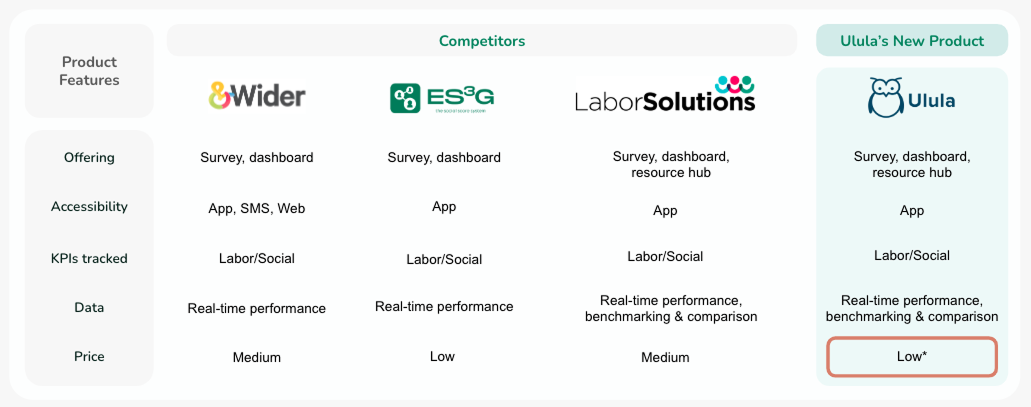
The sessions helped us validate the core solution as a survey + dashboard tool which is what competitors were able to offer at much lower price. The relatively higher price of Ulula’s standard tools is known to be a deterrent for prospects, so, we knew that we wanted to compete on this.
Suppliers experience audit fatigue due to multiple audits required by various buyers from the same facility. Introducing a referral feature would allow businesses to invite supply chain partners, streamlining audits and replacing the need for multiple tools.
Businesses require contextual and shareable data that can be included in corporate social sustainability reports and mandatory disclosures. Providing continuous analytics in a format that is downloadable, shareable and contextual meets this need effectively and differentiates from competitor dashboards.
Develop a product that delivers analytics to companies about labor and human rights risks within their supply chain at an affordable price
There are 2 parts to achieving this goal:
Collect data
Deploy surveys directly to supply chain workers through their mobile phones to collect feedback on their perception of working conditions and risks.
Display analytics
Aggregate and display analytics from data captured through worker feedback surveys on interactive dashboards.
Collecting data: a worker-facing survey app
To achieve the first part of the goal, collect data, we set out to develop a worker-facing mobile app that would be used to administer surveys to collect worker feedback on labor and human rights risks.
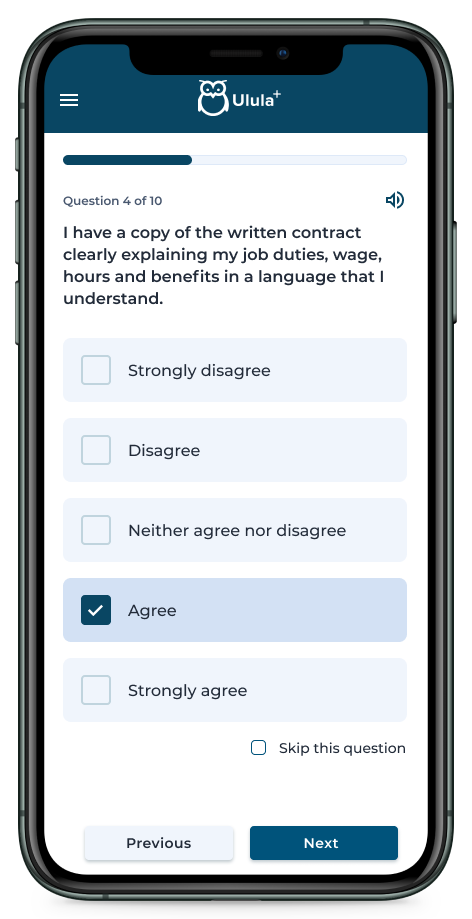
Build trust
Users of the app (workers in the supply chain) should feel safe answering questions and trust that personal information collected will not be mishandled or misused.
Encourage participation
It should feel easy and rewarding to complete the survey. We want to validate progress made, reduce drop-off and encourage re-engagement if users don’t complete the journey in one go.
Accessible and inclusive
Reduce barriers to access so that workers can participate regardless of language or literacy level.
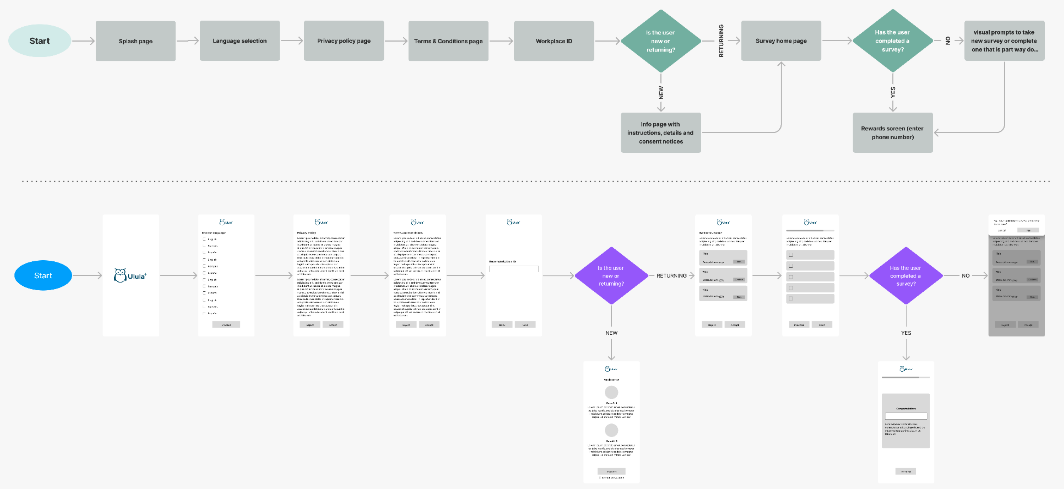
Mapping user flows
Mapping the critical path for a worker using the mobile app surveys.
Mockups on the survey app
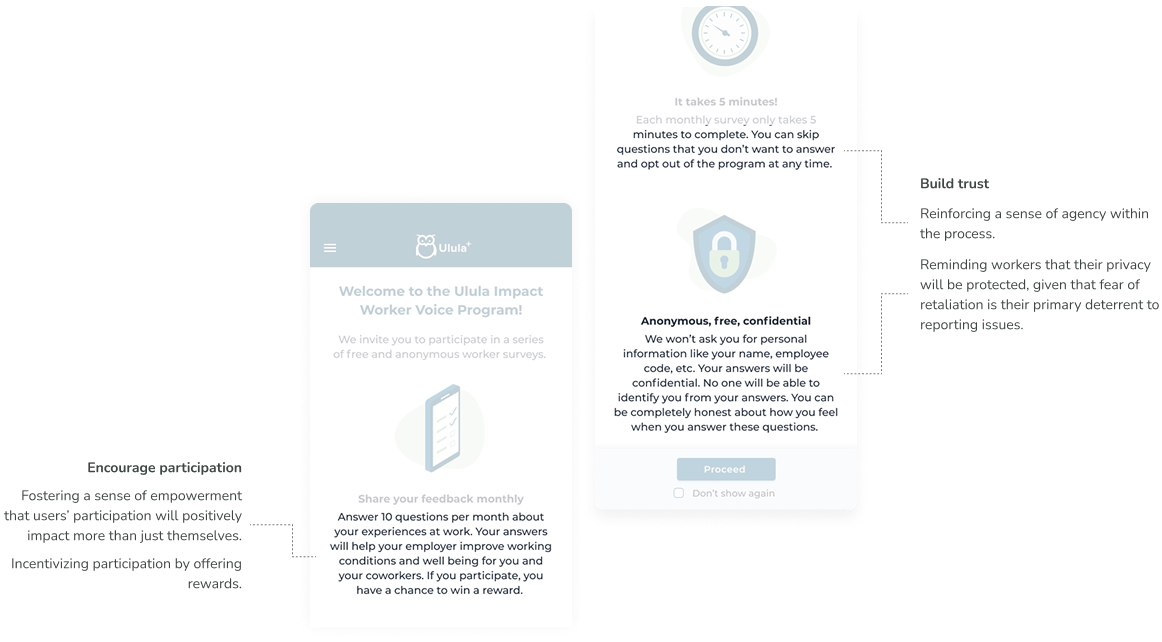
Building trust through UX copy that reiterates promise of anonymity and confidentiality
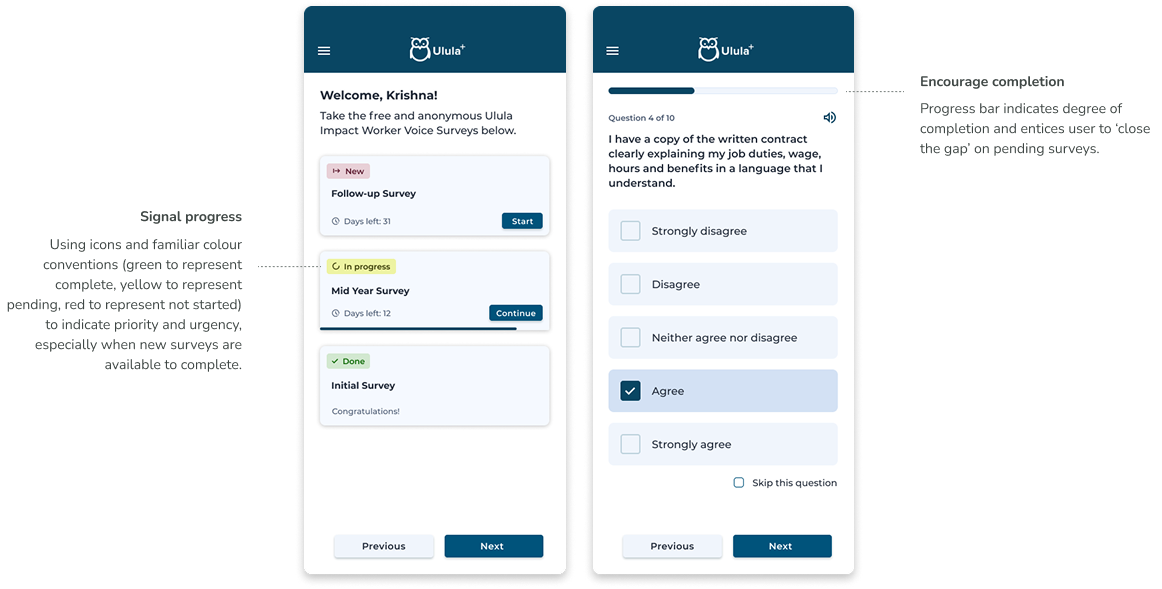
Including design patterns that encourage participation and completion
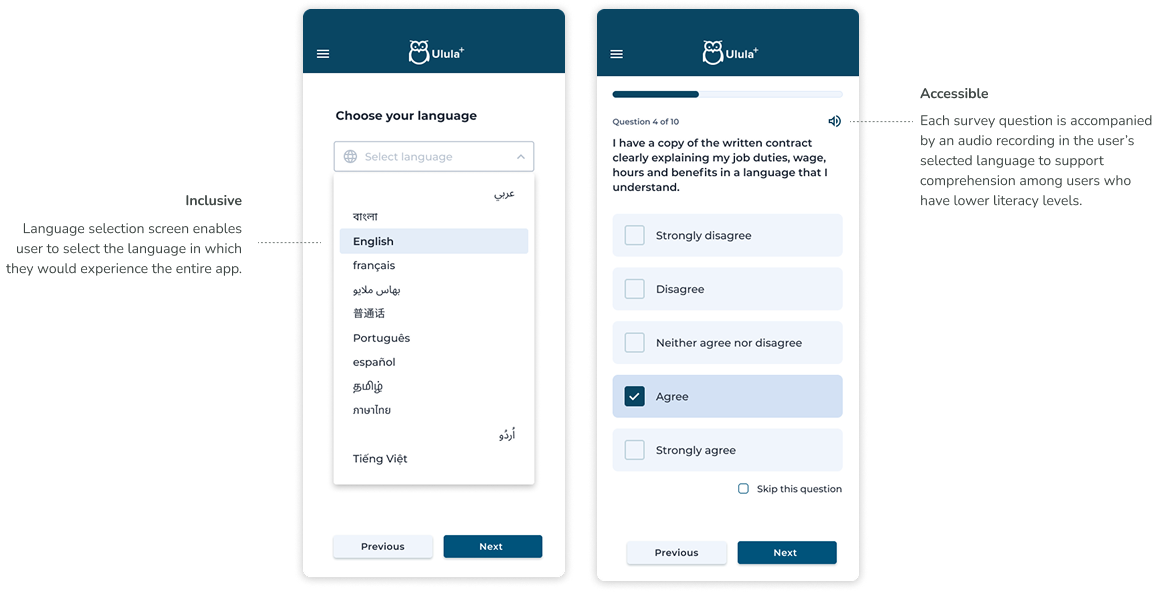
Designing audio and visual components to ensure accessibility across a diverse user base
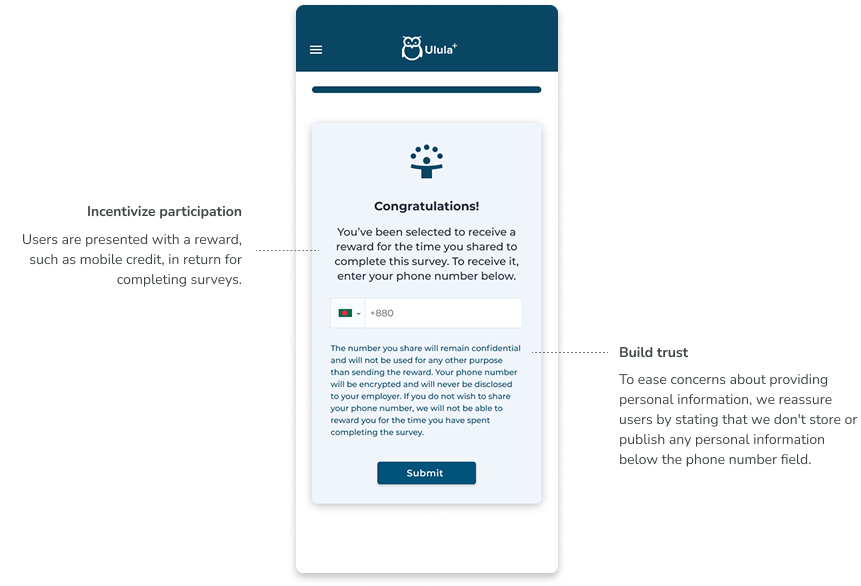
Offering meaningful, locally relevant incentives to encourage participation
Displaying analytics: an interactive, shareable dashboard
To achieve the second part of the goal, display analytics, we set out to develop an interactive and user-friendly dashboard that would display analytics based on worker feedback captured via mobile surveys.
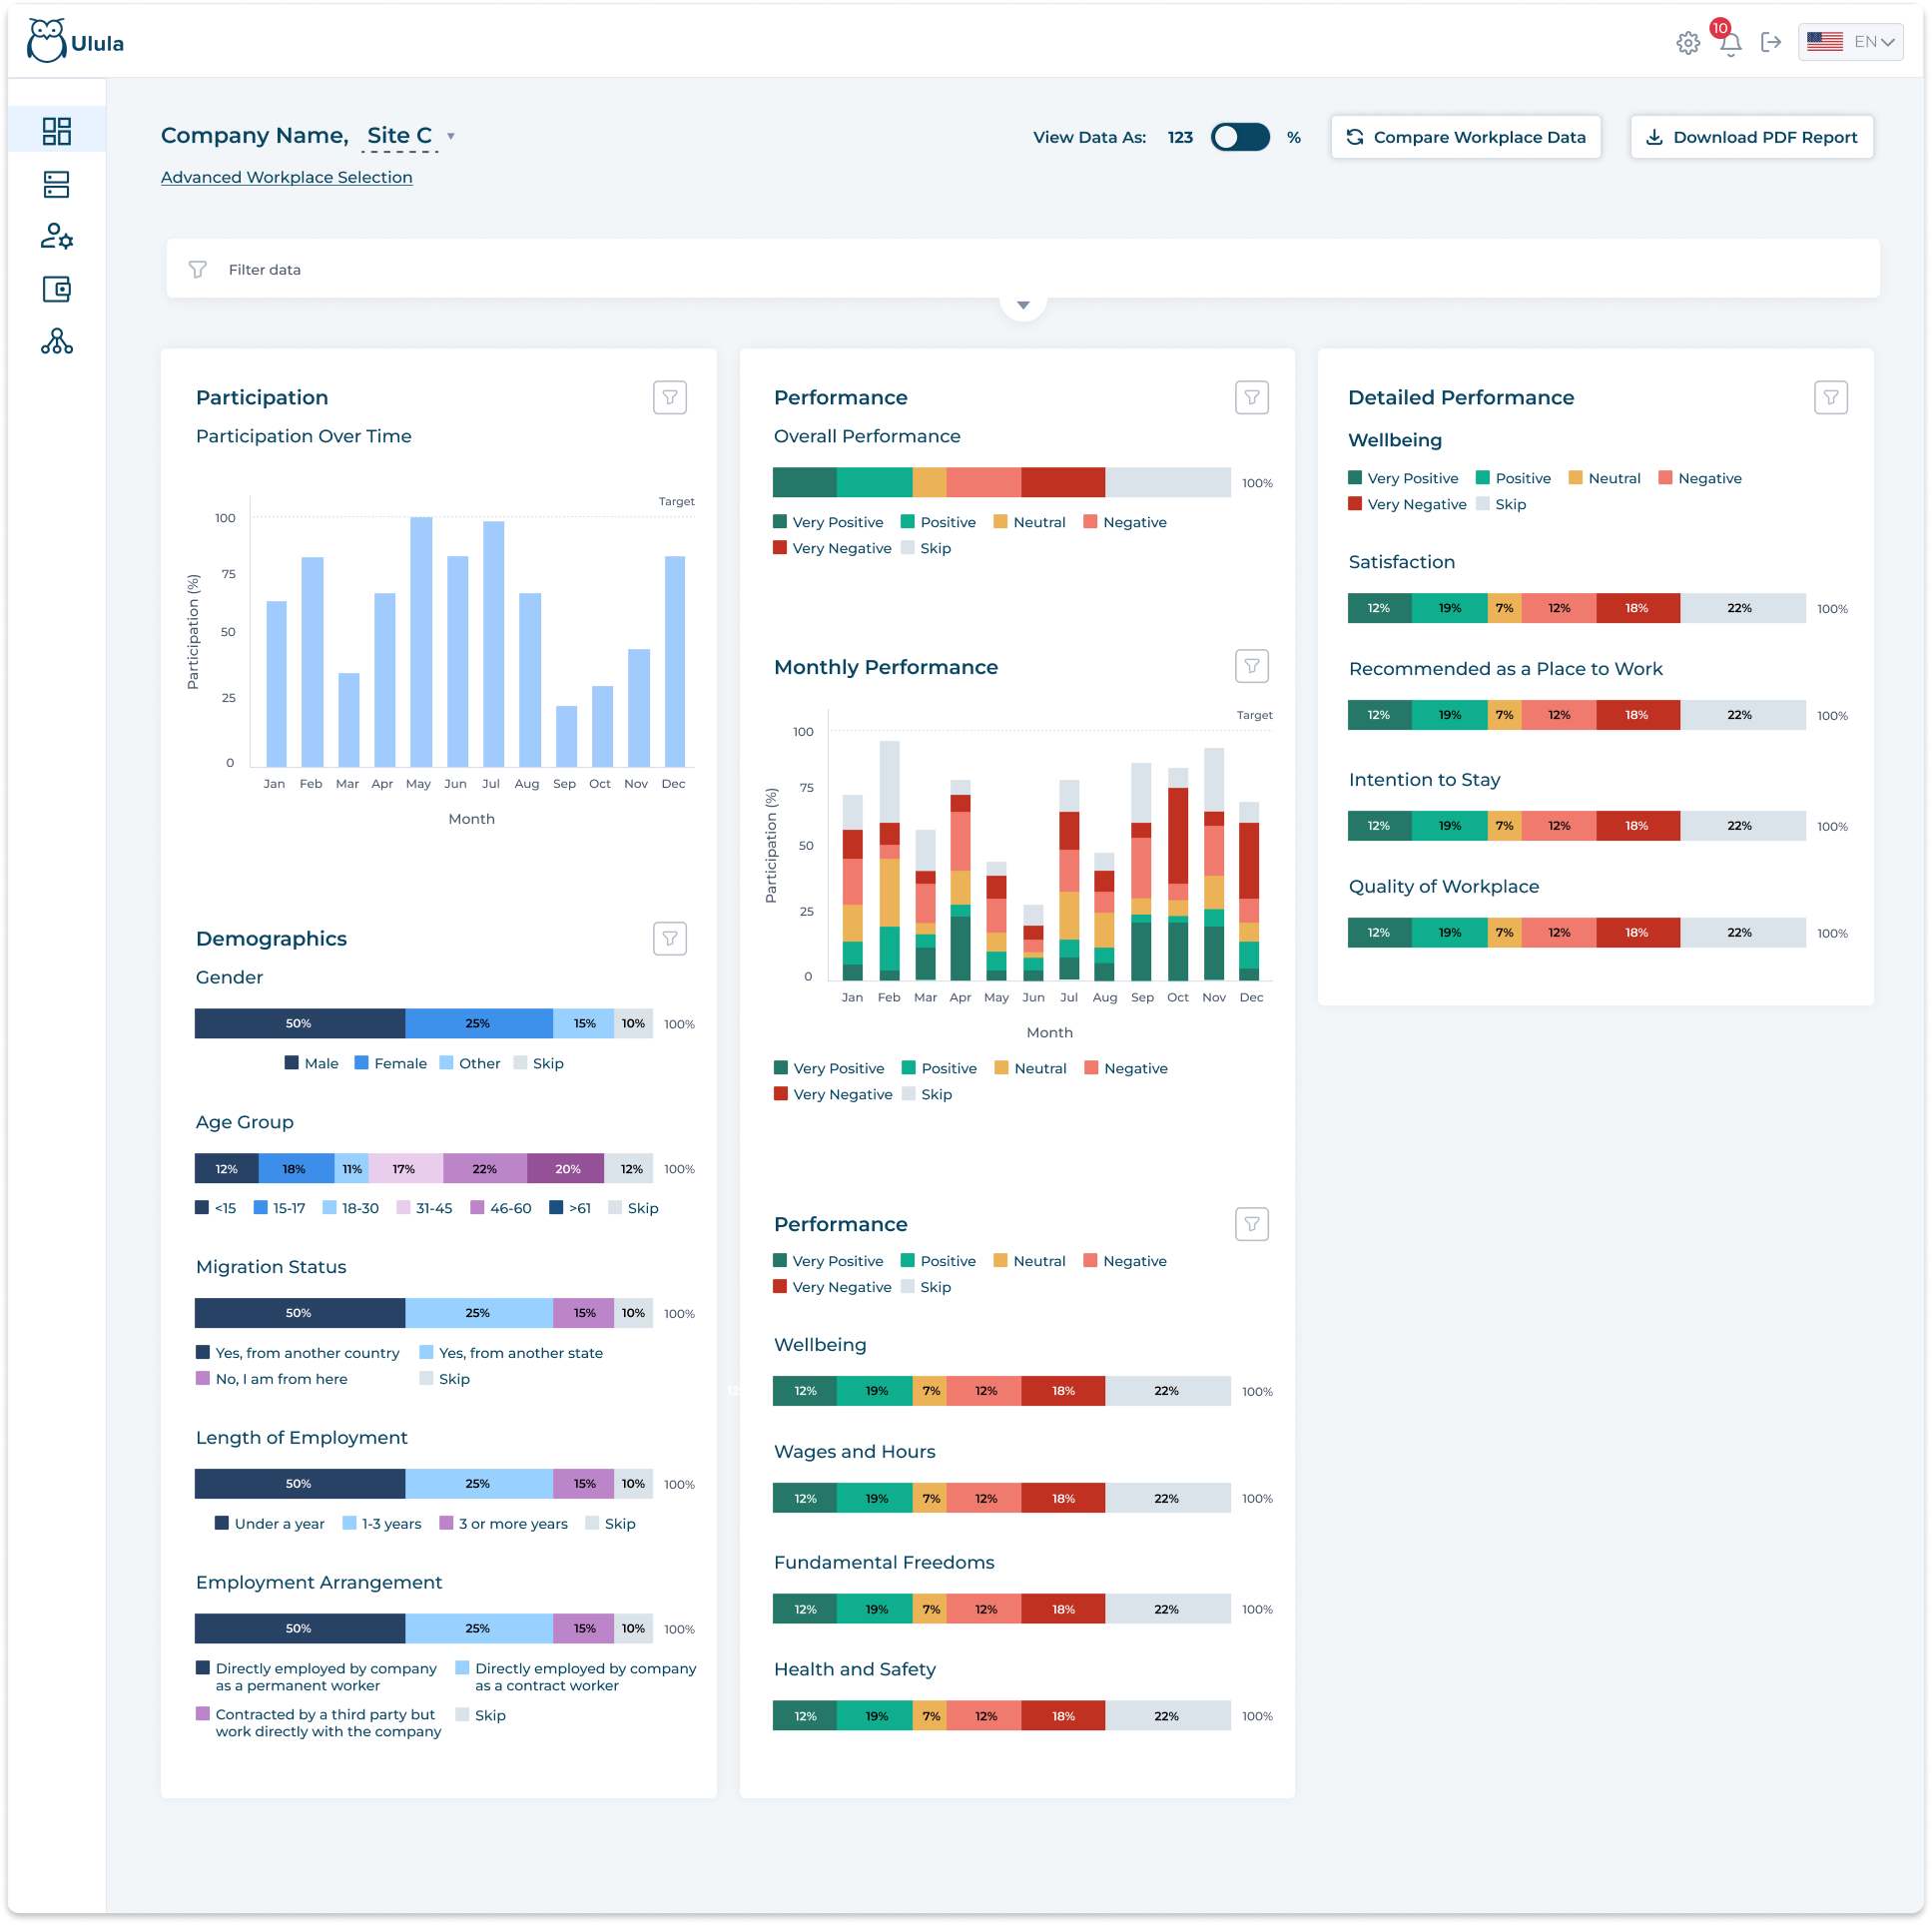
Interactive
Users of the dashboard (buyers, suppliers) should find it easy to interact with and interpret their data. They should get a sense of high-level performance as well as have access to additional context on specific segments as needed.
Shareable
The data should be available in formats that make it easy for users to include in corporate reports, share with colleagues and business partners, and inform strategic direction within the organization.
Information architecture
Determining dashboard content and hierarchy.
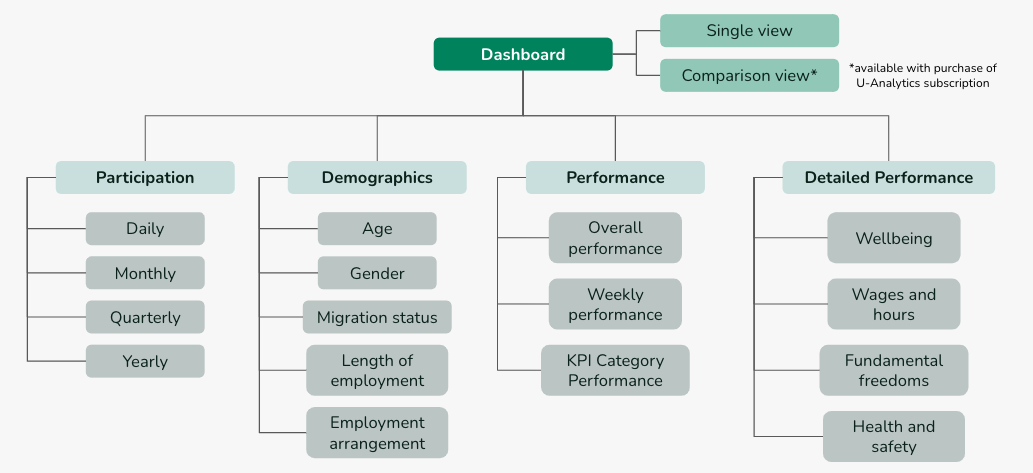
Mockups on the dashboard
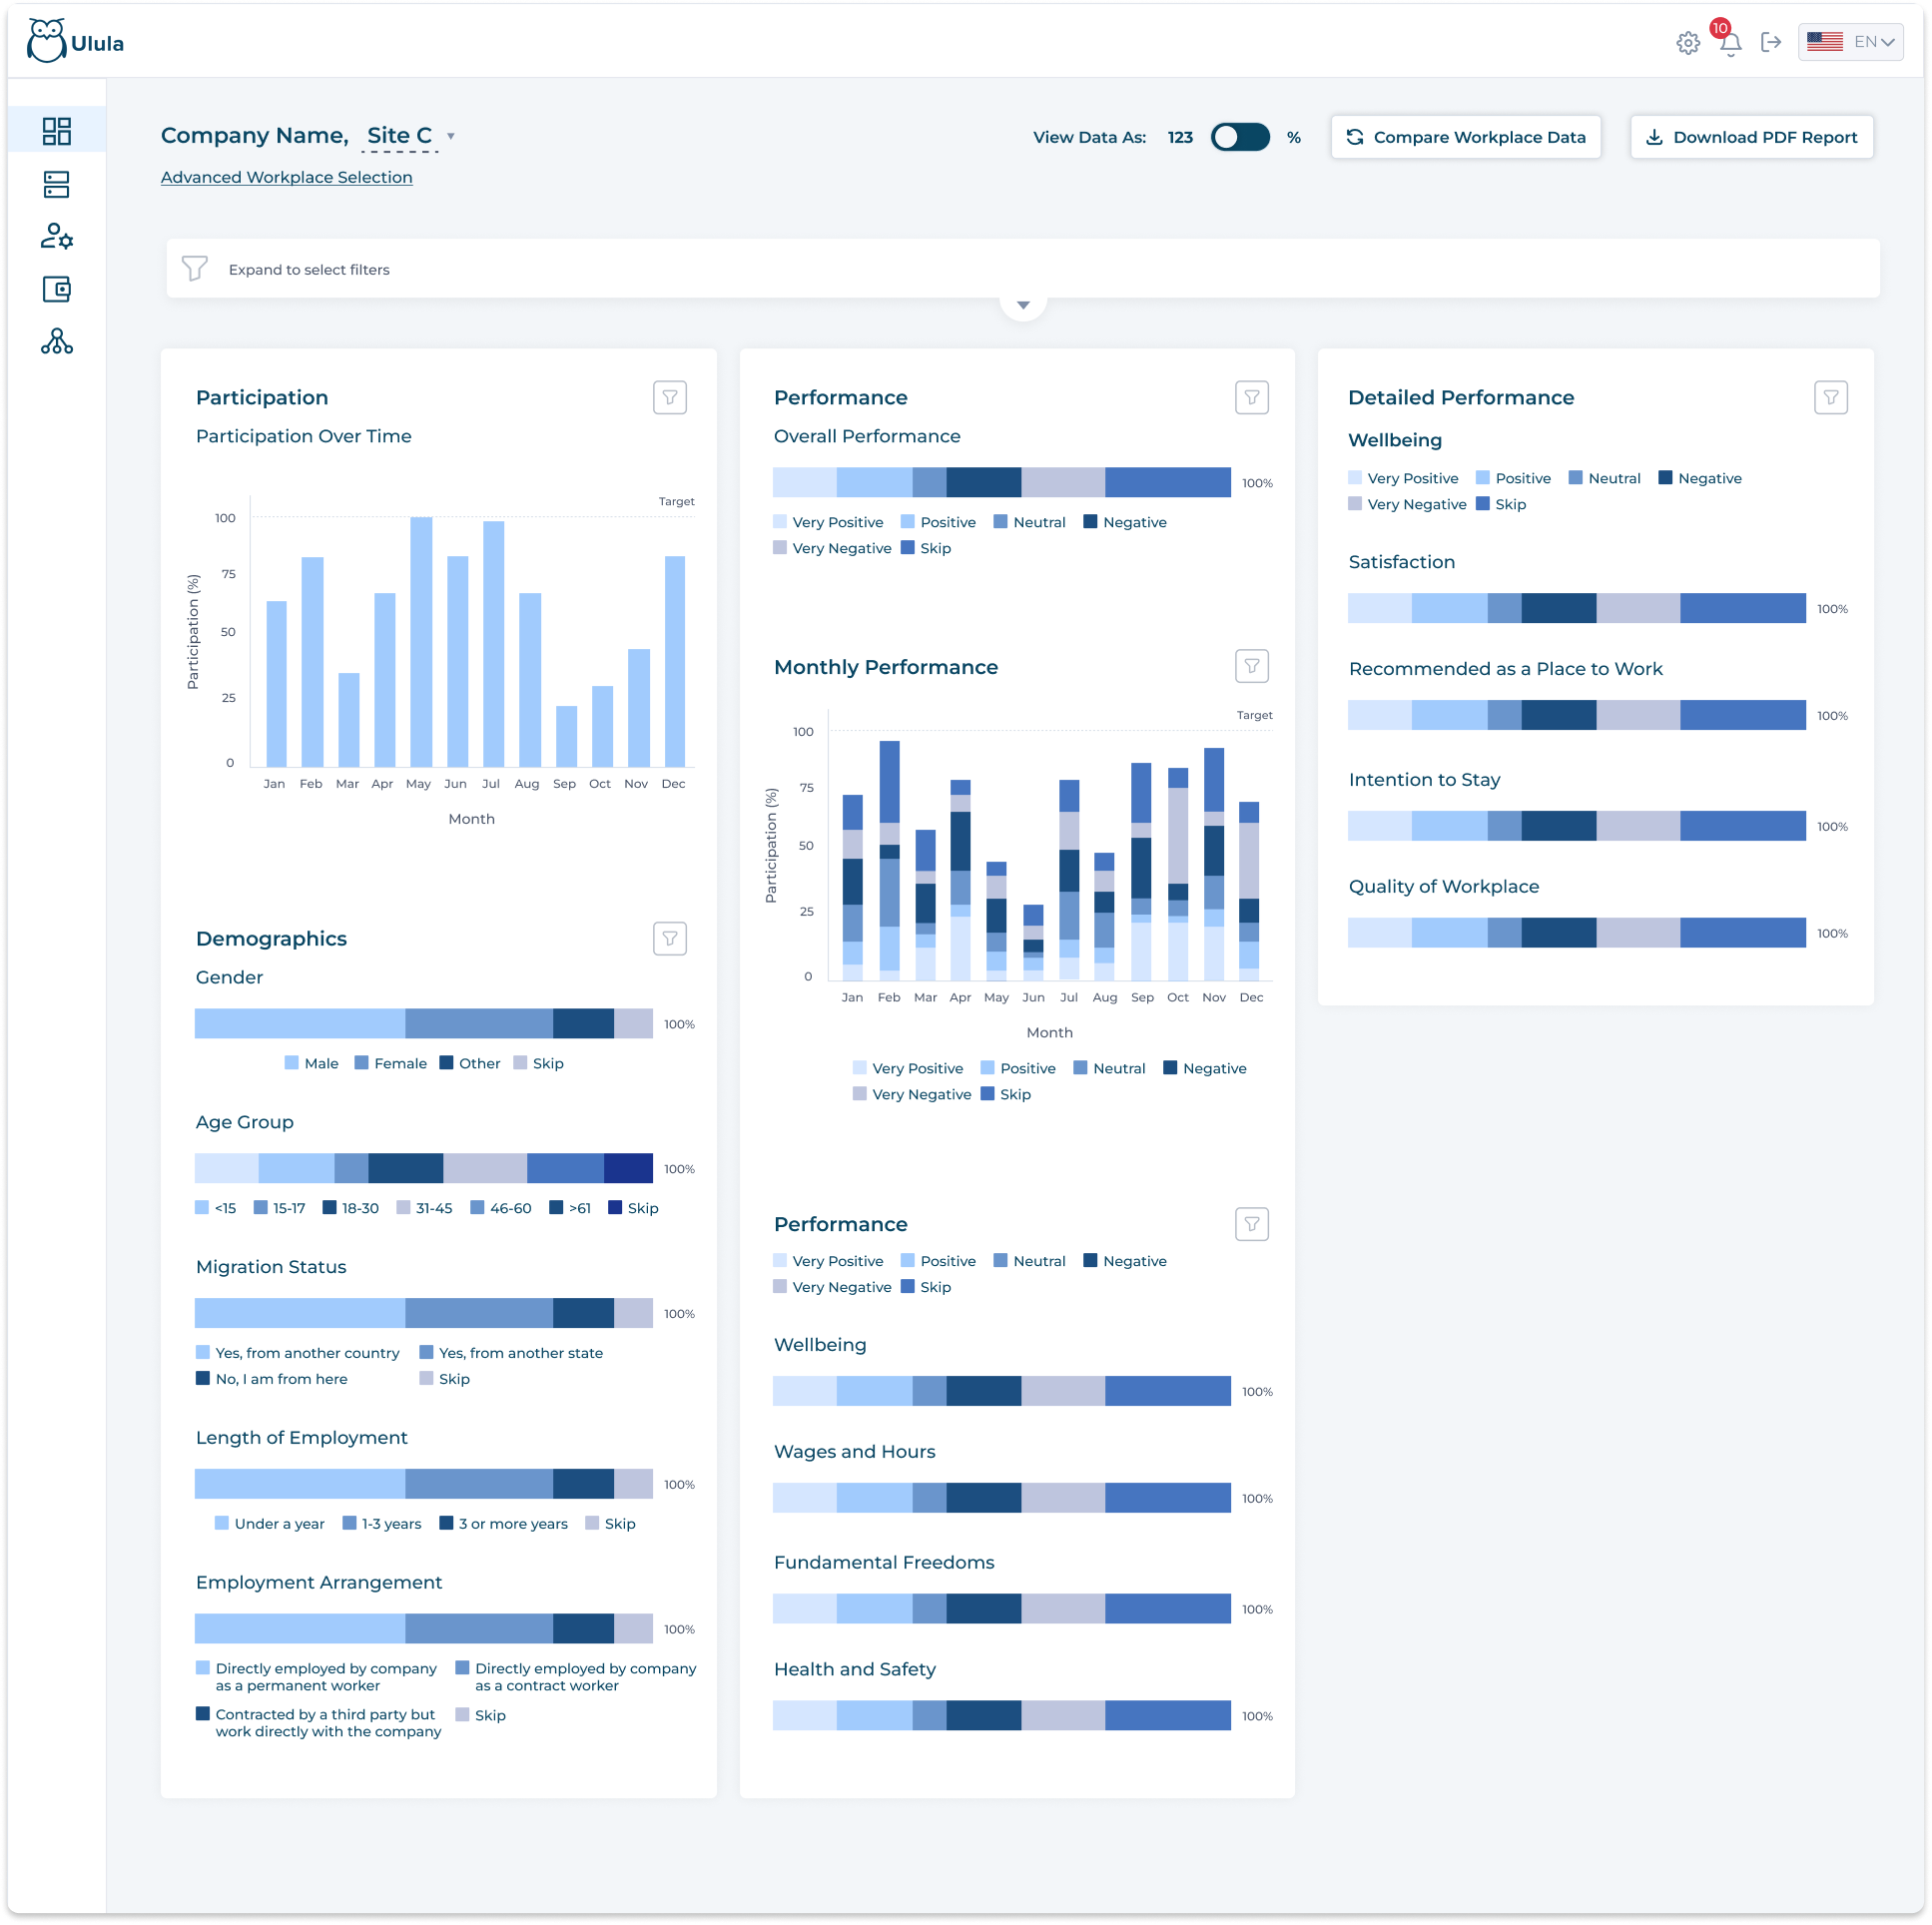
Applying a traffic light system colour scheme to signal risk
The color scheme enhances data readability, offering a quick visual indication of its significance: red and orange for higher risk, yellow for moderate risk, and shades of green for positive values like performance improvements.
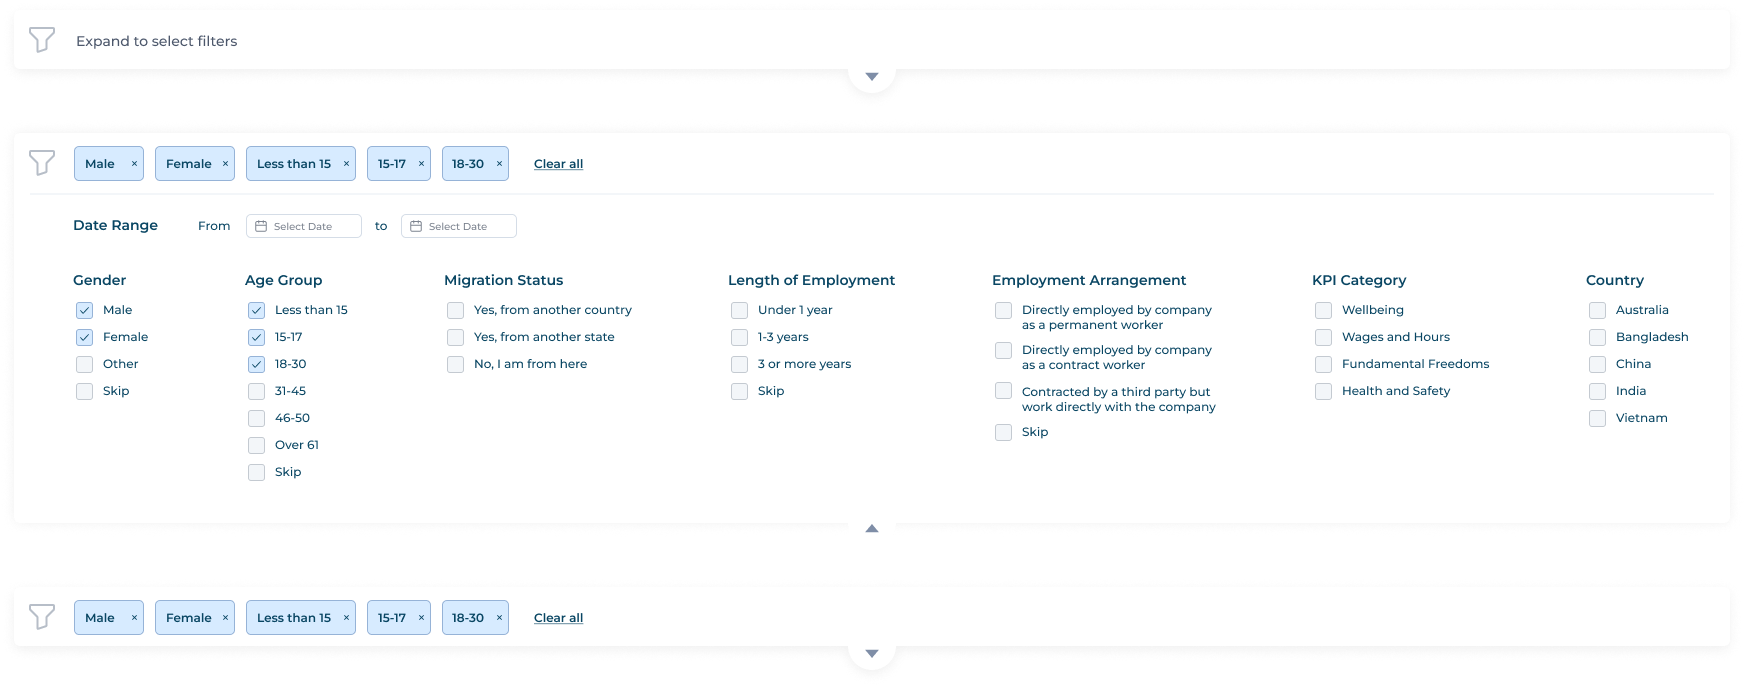
Robust global filter panel with visible tags
The filter panel comprises a robust set of criteria to filter data. When collapsed, applied filters are shown as tags at the top, giving users an ever present visual cue of the data view they are seeing.
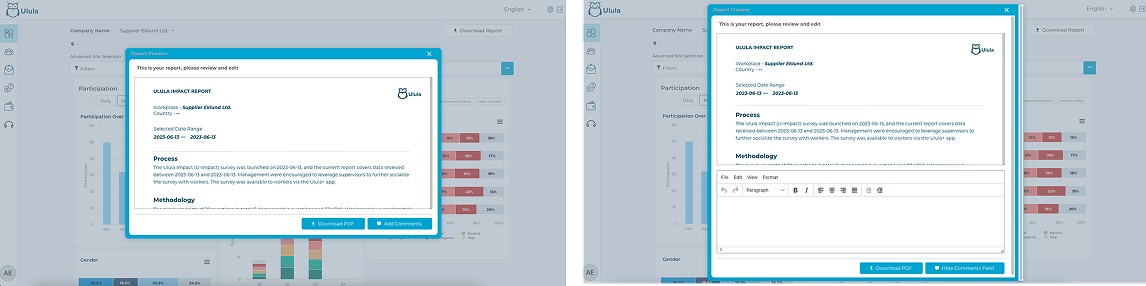
Comments section for context and personalized notes
From our persona mapping sessions and our familiarity with current clients’ behaviour, we knew that dashboard users would want to share performance data with internal and external stakeholders and provide context to the recipient. So, we added a comments section so that users can add notes before downloading the report.
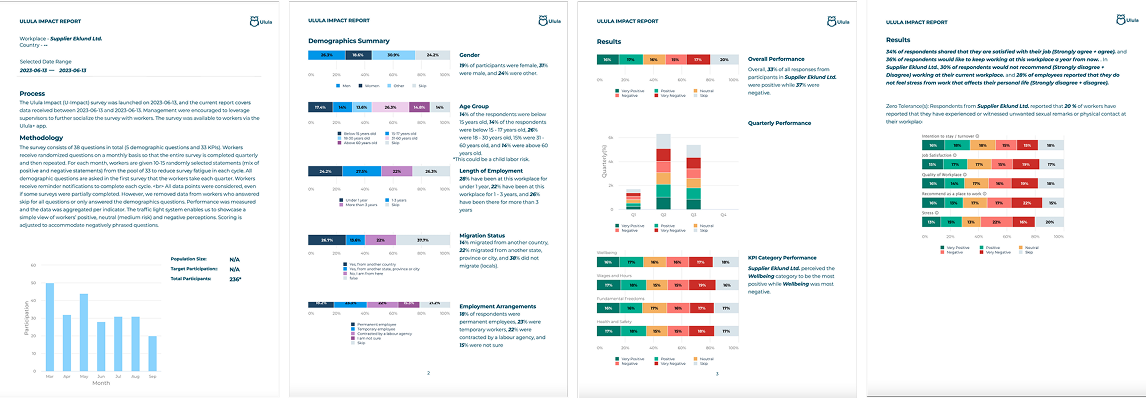
PDF reports that capture data and context at a glance or with applied filters
The product is set to launch at the end of 2024.
Expand customer base
with higher conversion rates from budget-conscious segments, leveraging our tool for initial steps and long-term commitment.
Boost referrals and conversions
by incentivizing current users to invite supply chain partners to join the platform.
Increase accessibility to comprehensive data and analytics
on labor and human rights risk and impact data, which is traditionally difficult to quantify and track, to support with compliance requirements.
Cut program development costs
with automation of traditionally expensive processes like mobile surveys, randomized question sets, and marketing materials customization.